Ask most teams how to analyze website traffic and the answer collapses into three sentences: "traffic is up, so business will follow", "we already have Google Analytics, there is no point moving the data anywhere" and "search rankings are the agency's problem, not ours". All three are comforting, and all three lead to the same place: a chart that gets opened once a month, looked at, and turned into no decision at all.
Our example is Marlin Workwear, a nineteen-person supplier of workwear and site safety kit. Most orders start as a quote request from the website, which makes the site the first step of the sales line rather than a brochure. (Every figure below is demo data.)
This guide takes five common beliefs in turn and puts the record that actually exists in Ohana360's Analytics360 add-on next to each one. The aim is not to introduce another dashboard, it is to be clear about which number says something and which one says nothing.
Myth 1: more traffic means more business
This is the expensive one. Traffic is an input, not an outcome. On its own, a rise tells you that more people opened your pages; it tells you nothing about whether they were the right people. September at Marlin Workwear is the textbook version.
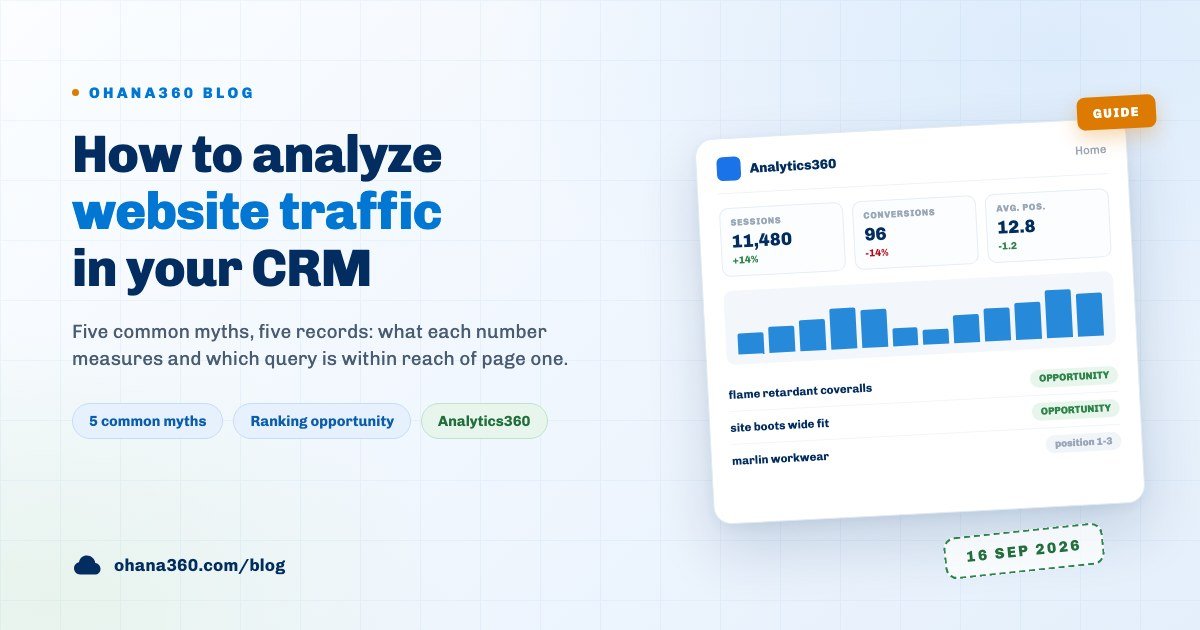
Sessions rose 14 per cent, search impressions rose 23 per cent, and conversions fell 14 per cent. Nobody reading that can say "traffic is going well". What they can say is "more people are arriving and not finding what they came for". The difference decides the work for the month: not a bigger ad budget, but a rewrite of the quote form and the product titles on the most-visited page.
Each of the six cards on the Analytics360 home page answers a different question, so it is worth being precise about what each one measures.
| Card | What it measures | What it does not |
|---|---|---|
| Sessions | Visits started on the site; one person coming twice is two sessions | How many different people came; that is the Users card |
| Users | Distinct people who reached the site in the period | Whether they were new or returning; New Users is its own field |
| Conversions | The actions you marked as key events in GA4 | Which action happened how often; they all land in one number |
| Search clicks | Clicks arriving from Google search results | Traffic from ads, social or direct visits |
| Search impressions | How often your site appeared in search results | How many people saw it; one person can search repeatedly |
| Avg. position | Your average rank in search results, where 1 is the top | Your rank on any single query; the query list covers that |
The period switch offers 7, 28 and 60 days, and every percentage compares against the previous period of the same length. There is a side effect worth knowing: in the first days after connecting, the 60-day view shows "no previous period" on the cards, because there is not enough history yet to compare against.
Myth 2: we already have Google Analytics, so this is duplication
It is not duplication, it is joining. Google Analytics knows visitors and not customers; a CRM knows customers and not visitors. While the two live on separate screens, answering "what did the site do after the newsletter went out" is a memory game played across two browser tabs.
Analytics360 closes that gap by moving the data. You connect the Google account once; the server pulls GA4 and Search Console every hour and writes into three objects. The record shape matters, because it decides what you can actually do with it.
| Object | What one record represents | Fields |
|---|---|---|
| Site Traffic | One day | Day, Date, Sessions, Users, New Users, Conversions, Revenue, Search Clicks, Search Impressions, Average Position |
| Search Query | One of the top 25 queries of the last 28 days | Query, Clicks, Impressions, CTR %, Position, Last Sync |
| AI Traffic | One day and one AI source | Day and Source, Date, AI Source, Sessions, Users, New Users, Conversions, Revenue |
These are custom objects, which means they follow the same rules as the rest of the CRM: a full list view with filters, column selection, sorting, saved views, export and double-click inline editing. They appear in the Object Manager so you can add your own fields, and in the REST API they are cobj_sitegun, cobj_sitesorgu and cobj_siteai.
The most useful habit in practice takes a minute: filter the Site Traffic list by date and mark a campaign week, or the day a newsletter went out. The newsletter guide covers the sending side; the record here is that send seen from the website.
Myth 3: search data belongs to the agency
Search data is not an SEO report, it is a customer dictionary. The sentences people type to find you show how they name your product in their own words. Aligning your quote wording, your page titles and the conversation in the field with those words is a sales job, not an agency one.
Analytics360 pulls the 25 most-clicked queries of the last 28 days from Search Console and turns each one into a Search Query record. On the home page the list surfaces twice: as a top queries table and as the Ranking Opportunities card. The second one is the decision tool, because it filters the raw list for you.
The rule looks for three conditions at once: at least 100 impressions, an average position between 4 and 20, and a click-through rate below 3 per cent. When all three hold, the query joins the list, ordered by impressions and capped at eight rows. The three rows that fail in the table above explain why the rule is drawn so tightly.
- A query at position 1 to 3 never appears. You are already at the top; rewriting the title has a limited upside and a real downside. Searches for your own brand name usually sit here.
- A click-through rate above 3 per cent keeps it out. The title is doing its job. The constraint there is not visibility but capacity, and it gets solved on the page itself rather than in the title.
- Fewer than 100 impressions keeps it out. At eighty-four impressions a click-through rate is noise, because a single extra click nearly doubles it. The threshold stops one-click swings from filling the list.
What do you do with a query from the opportunity list? The most reliable move is to turn it into a page title or a Knowledge360 article. At Marlin Workwear, "site boots wide fit" was landing on a general category page in fifteenth place; a page whose title is that exact sentence shows its position move in the same list two or three weeks later. It is the same selection logic as the one in the knowledge base guide: the customer's sentence becomes your heading.
Myth 4: traffic from AI tools cannot be measured
It cannot be measured exactly, but it can be tracked. The AI Traffic Report sits at the bottom of the home page and reads GA4's referral source to separate five names: ChatGPT, Gemini, Claude, Perplexity and Microsoft Copilot. The report gives three numbers, a stacked daily chart and a source table: AI sessions, share of total traffic and AI conversions.
The method also sets the limit. Only a visitor who clicked a link inside the AI tool is counted. If someone types the address by hand, or the tool hides the referrer, that visit reads as direct traffic and never reaches the report. The number here is therefore a floor rather than a total.
Being a floor does not make it useless. Read it as a trend: a share that grows three months running means your content has started being cited inside those tools, and that is a visibility channel independent of your search ranking. Each row of the source table shows sessions, share and the change against the previous period; open the AI Traffic list for the user and conversion breakdown.
Myth 5: connecting a Google account is risky and fiddly
It is three steps and it is read-only. Connect Google on the Analytics360 home page is visible to admins only; you pick your account in the Google window and grant access, and your password never reaches Ohana. When the window closes you choose the GA4 property and the Search Console site to track and press Save and Sync. If your account holds a single property and a single site, both are selected for you.
The permissions are read permissions: Ohana changes nothing in your Google account and writes no settings there. The connection is held by a refresh token that does not expire, so there is no monthly reconnection ritual. If you revoke access on Google's side, the card shows a Warning and Reconnect puts it right.
After that it runs itself. The server works hourly and skips an organization whose last sync is less than fifty minutes old. Every run pulls the last 60 days again; a day never gets a second record, the existing one is updated. That detail works in your favour, because figures Google revises later are reflected on the record too.
| Question | What the product does |
|---|---|
| How often does data arrive? | Hourly, on the server; Refresh from Google runs it on demand |
| What does the first sync load? | The last 60 days, and every later run refreshes the same 60 days |
| How long do records stay? | 120 days; each sync drops older Site Traffic and AI Traffic rows |
| How do I pause the sync? | Set the "Google veri senkronu" card under Setup > Automations to Inactive |
| What happens if I disconnect? | The records stay, only new data stops arriving |
| How many Google accounts? | One per organization; several properties need separate orgs or one chosen property |
Connecting leaves two traces on the setup side: a "Google veri senkronu" card under Setup > Automations and Google Analytics 4 and Google Search Console rows under Setup > Integrations, both created for you. Three months later you will not have to remember which automation pulls which data.
How Analytics360 works in Ohana360
Analytics360 is an add-on, enabled from the Marketplace in one click. Here is what it does, without inflation, and what it does not do, without hiding it.
- Tabs: Home, Site Traffic, AI Traffic and Search Queries. Add-on apps are kept deliberately plain, so the shared tabs are not added to this one.
- The home page: six summary cards, the period switch (7, 28, 60 days), the daily traffic chart, the Ranking Opportunities card, a table of the ten most-clicked queries and the AI Traffic Report at the bottom.
- The Google connection card: at the foot of the home page, admins only. Status, the connected email, last sync, run count, the GA4 property and Search Console site selectors, and the buttons Save and Sync, Sync Now, Reconnect and Disconnect.
- The daily chart: session bars with search-click and conversion lines on the same chart; Open all days jumps to the Site Traffic list.
- The query table: the top ten queries with clicks, impressions, CTR and position; clicking a row opens that query's record page.
- The lists: all three objects are full list views. Filters, column selection, sorting, saved views, export and double-click inline editing all work.
- Setup side: all three objects appear in the Object Manager, so you can add your own fields and validation rules. They are listed in sharing settings and in the profile and permission set matrix.
- Flows: scheduled flows can target these objects, for example a notification for days that fall below a threshold you set.
- With Marketing360: Google Ads campaign tracking belongs to Marketing360 and uses the same Google connection. Analytics360 works with GA4 and Search Console alone; Google Ads is not required.
Not included: what Analytics360 does not do
- No page breakdown. Search Console data is pulled on the query dimension only. Which page ranks for which query, and the country, device and search type splits, do not arrive.
- Only five GA4 metrics. Sessions, users, new users, key events and purchase revenue. Page paths, landing pages, channels, devices, bounce rate and session duration are not pulled.
- No link between a visit and a record. No relationship field connects a Site Traffic record to leads, opportunities or orders; you make that connection by date.
- No query history. The Search Query list is rebuilt against the top 25 on every sync; a query that drops out is deleted, and the path of a position over time is not kept.
- Not directly available in the Report Builder. The Report Builder lists the objects of the app you are in, and the Analytics360 tab bar has no Reports tab. To report on these objects, move the object's App field in the Object Manager to an app that has reporting.
- Record-triggered flows do not fire on the sync. The sync writes records on the server, so a flow set to run "when a Site Traffic record is created" is not triggered by it. A scheduled flow can scan these objects instead.
- Nothing older than 120 days. Each sync drops Site Traffic and AI Traffic rows past that window, so year-on-year comparison needs a regular export.
- No targets, alerts or forecasts. There is no "session target" field, no alert that emails you when a threshold is crossed and no forward projection.
- One Google account. One account per organization; watching several properties at once means opening separate orgs.
Want to see the flow in 73 seconds?
Turning website data into a decision in seven days
| Day | What to do | Time |
|---|---|---|
| 1 | Enable Analytics360 from the Marketplace, press Connect Google as an admin and pick the GA4 property and Search Console site | 15 minutes |
| 2 | Open the 60 days the first sync brought in the Site Traffic list; set the columns to sessions, conversions and search clicks and keep it as a saved view | 20 minutes |
| 3 | Set the period to 28 days, read the six cards and write one sentence: is this month a traffic problem or a match problem | 20 minutes |
| 4 | Read the Ranking Opportunities card, pick three queries and note which page is responsible for each one | 30 minutes |
| 5 | Move those three sentences into page titles, or open a Knowledge360 article for each | 60 minutes |
| 6 | Open the AI Traffic Report and write down today's share; that is the baseline you will compare against in three months | 15 minutes |
| 7 | Announce the rhythm: first Monday of the month the cards get read, the query list gets exported, one opportunity query gets picked up | 20 minutes |
From the second month there is one habit to hold: read the six cards once a month and take on one query. Over six months that rhythm moves both your page titles and your sales language closer to the words your customers use. To read website data next to quotes and orders, the sales tracking guide covers the other end of the funnel, and if your numbers still live in a spreadsheet, customer tracking in Excel shows what the switch costs. Current plans are on the pricing page, and you can request a demo to try it with your own site.
Frequently asked questions
How do you analyze website traffic without drowning in numbers?
Why move Google Analytics data into a CRM at all?
What exactly makes a query a ranking opportunity?
How often does the data refresh, and how far back does it go?
Can visits from AI tools really be separated out?
Does Analytics360 let me build reports and dashboards?
Stop reading traffic, start deciding with it
Let the Google numbers land as one record a day, let the queries within reach of page one flag themselves, and make the call from a record instead of a chart.